Possible RAGBRAI routes via Python
Introduction
I’ve signed up to ride RAGBRAI LIII in July 2026. This is my first time riding RAGBRAI, and being a geek, I was curious about possible routes. So, using the first 52 routes, some Python, and the Monte Carlo method, I wrote a little program to figure out the possible routes and the likelihood of each route.
There’s a lot to unpack in that first paragraph. So, here goes:
- RAGBRAI: This originally meant Register’s Annual Great Bike Ride Across Iowa. I don’t think this acronym is used these days. But the name stuck.
- Monte Carlo method: a numerical method that relies on repeated random sampling to obtain results. So this does simulations with random number generation to figure out routes.
What Do We Know?
The first 52 RAGBRAI routes are published in various places. I grabbed the routes from this Wikipedia page, and converted them to a CSV file using Emacs Org mode and a little hand editing.
Now what?
From the CSV file, I can create adjacency lists, which I represent in Python as a dictionary of unordered lists that describe the neighbors for each node. In this case, this is representing the overnight towns and the next or previous town on the route.
I also save a list of starting and ending towns, so I know where routes have started or ended in the past.
51 of the 52 routes have 8 nodes, as RAGBRAI runs from Sunday to Saturday. But the first RAGBRAI route only has 7 nodes, so I needed to take that into account. This was just a little extra code.
Once I’ve got the adjacency lists, I can run the Monte Carlo simulations. I initially implemented this beginning with a random starting town. For each town, I picked a random link to the next town. If there’s a town that next visits the same town multiple times, then that next visited town will be in the adjacency list multiple times.
But I noticed there were many routes created that didn’t end in one of the ending towns. Eliminating those, the method was heavily biased towards only starting a couple of towns. Hmmm.
So I tried started with the end towns and moving backwards. This gave a much better spread of starting and ending towns in the simulation. So I stuck with building routes from the end town backwards to the start.
Code
First there are some imports:
from collections import defaultdict
import csv
import graphviz
from operator import itemgetter
import random
Next I set up a tuple of days I can use with the CSV reader to grab fields from each line of the CSV file.
days = (
    "Starting City",
    "Sunday",
    "Monday",
    "Tuesday",
    "Wednesday",
    "Thursday",
    "Friday",
    "Saturday",
)
I also create empty lists for the starting towns and ending towns, and
create the adjacencies dictionary using defaultdict so
each dictionary value will be set up as a list when it is first
accessed.
starts = []
ends = []
adjacencies = defaultdict(list)
Parsing the CSV file into adjacency lists
This function parses the CSV file a couple of times using the Python “csv” package to read the CSV file as a dictionary. The first time through is to find the starting and ending towns.
The second time reading the CSV file is to create the adjacency lists. I start with the days, reversed, to go from the end of a route to the beginning.
def parse():
    with open(
        "/home/davemarq/shell-scripts/ragbrai-by-year.csv", newline=""
    ) as csvfile:
        reader = csv.DictReader(csvfile, delimiter=",")
        for row in reader:
            starts.append(row["Starting City"])
            if row["Saturday"] != "N/A":
                ends.append(row["Saturday"])
            else:
                ends.append(row["Friday"])

    with open(
        "/home/davemarq/shell-scripts/ragbrai-by-year.csv", newline=""
    ) as csvfile:
        reader = csv.DictReader(csvfile, delimiter=",")
        for row in reader:
            prev = None
            for d in reversed(days):
                if prev is None:
                    prev = d
                elif row[prev] != "N/A":
                    adjacencies[row[prev]].append(row[d])
                prev = d
Making routes
Once I have the adjacency lists, I want to create random routes. A route starts with a random end town. For each town, I pick one of its neighbors based on its adjacency list, using a random number generator. I append the random choice to the route list. Once I have a full route, that goes from end to start, I return its reverse.
def makeroute():
    route = []
    cur = random.choice(ends)
    route.append(cur)
    for i in range(7):
        try:
            next = random.choice(adjacencies[cur])
        except IndexError:
            return None
        route.append(next)
        cur = next
    if cur not in starts:
        return None

    return reversed(route)
Making a graph
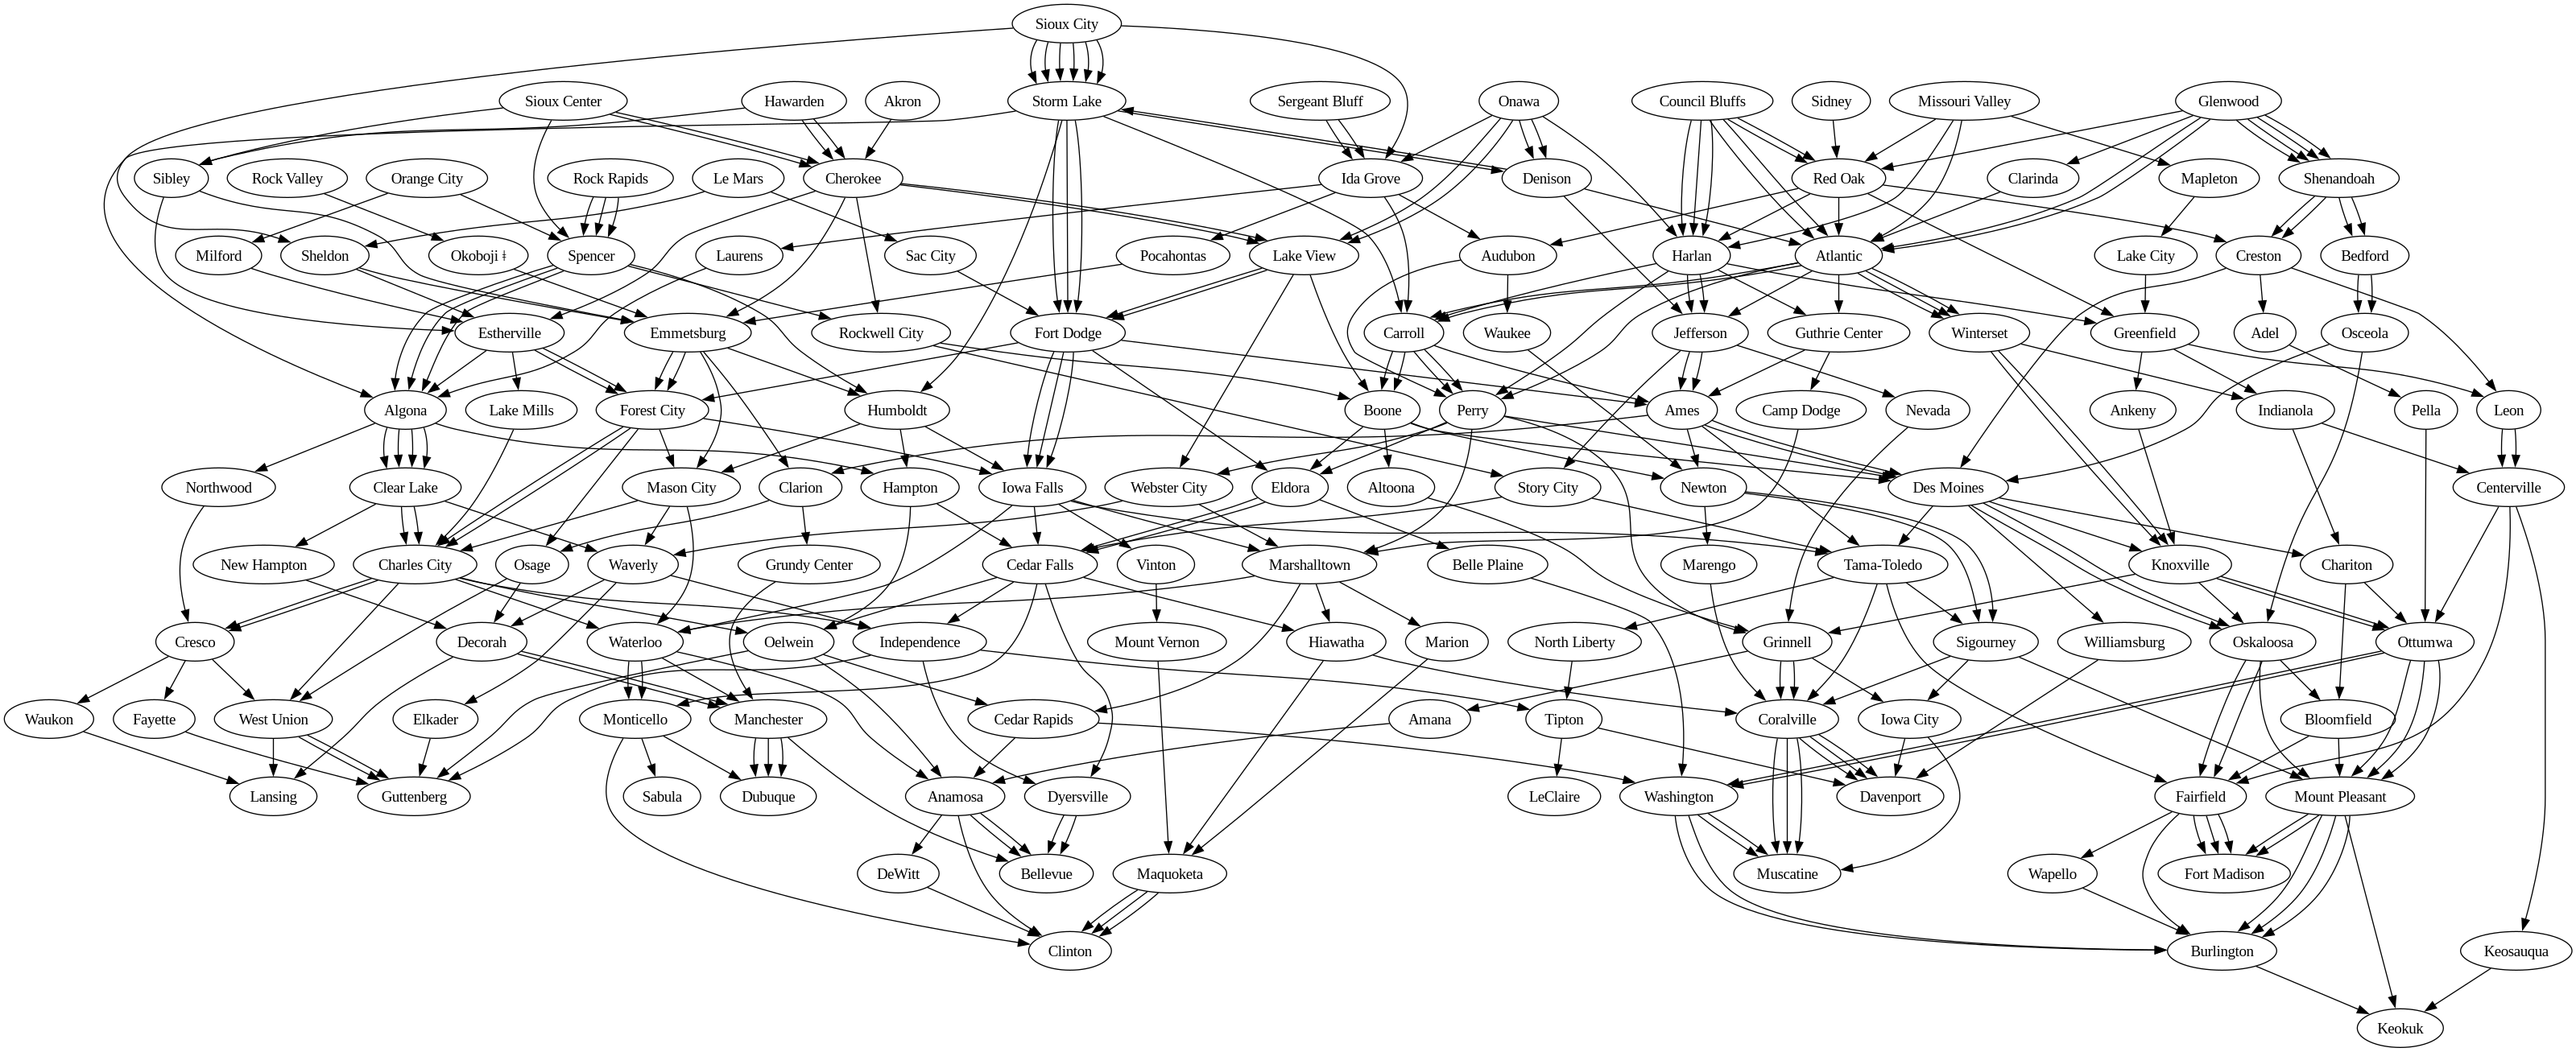
I also thought it would be nice to get a graph of all the towns linked to each other from existing routes. This gives a nice visual representation showing how often the routes go from town to town. For example, routes from Sioux City visited Storm Lake next 6 times, so there will be 6 arrows from Sioux City to Storm Lake.
I inially created this code manually to create a Graphviz directed graph, or digraph. But I thought, there’s gotta be a Python package for this. Sure enough, there is.
def make_graph():
    dot = graphviz.Digraph(name='ragbrai', format='png', engine='dot')
    for a in adjacencies:
        for node in adjacencies[a]:
            dot.edge(node, a)
    dot = dot.unflatten()
    dot.render(view=True)
Here’s the graph based on the 52 existing routes.
Do the work!
Okay, now the main code starts. It parses, then creates the graph. Finally, it does the Monte Carlo method.
The Monte Carlo method here creates routes 1,000,000 times. It tracks how many times each route is created through a dictionary. Once created, We get told how many unique routes were created and then the routes are sorted by count and printed, along with the count for each. Typically the method creates a little over 7000 unique routes. The results are pretty consistent, with a route from Sioux City to Clinton getting a bit over 10000 hits, i.e. about 1% of the possibilities. It’s also fun to look at the bottom of the list for those “1 in a million” routes.
Here’s the first fiew lines of typical output:
Opening in existing browser session.
Created 7230 unique routes
('Sioux City', 'Storm Lake', 'Fort Dodge', 'Iowa Falls', 'Vinton', 'Mount Vernon', 'Maquoketa', 'Clinton') 10433
('Glenwood', 'Shenandoah', 'Creston', 'Adel', 'Pella', 'Ottumwa', 'Mount Pleasant', 'Burlington') 6969
('Rock Rapids', 'Spencer', 'Algona', 'Clear Lake', 'New Hampton', 'Decorah', 'Manchester', 'Dubuque') 6153
('Glenwood', 'Shenandoah', 'Creston', 'Adel', 'Pella', 'Ottumwa', 'Washington', 'Muscatine') 5483
('Glenwood', 'Shenandoah', 'Creston', 'Adel', 'Pella', 'Ottumwa', 'Mount Pleasant', 'Fort Madison') 5261
And here’s the final bits of code.
parse()
make_graph()

routes = defaultdict(int)

for i in range(1000000):
    r = None
    while r is None:
        r = makeroute()
    routes[tuple(r)] += 1
print(f"Created {len(routes)} unique routes")

sortedroutes = dict(sorted(routes.items(), key=itemgetter(1), reverse=True))
for r in sortedroutes:
    print(r, sortedroutes[r])